Industry
Retail / F&B
Stack
Power BI / ETL
For this project, Matrix Digital handled the end-to-end data pipeline. We began by cleaning raw transaction data, applying ETL (Extract, Transform, Load) processes to handle discrepancies, and finally building a high-performance Power BI dashboard. This allows coffee shop owners to monitor performance in real-time and make data-backed decisions to enhance profitability.
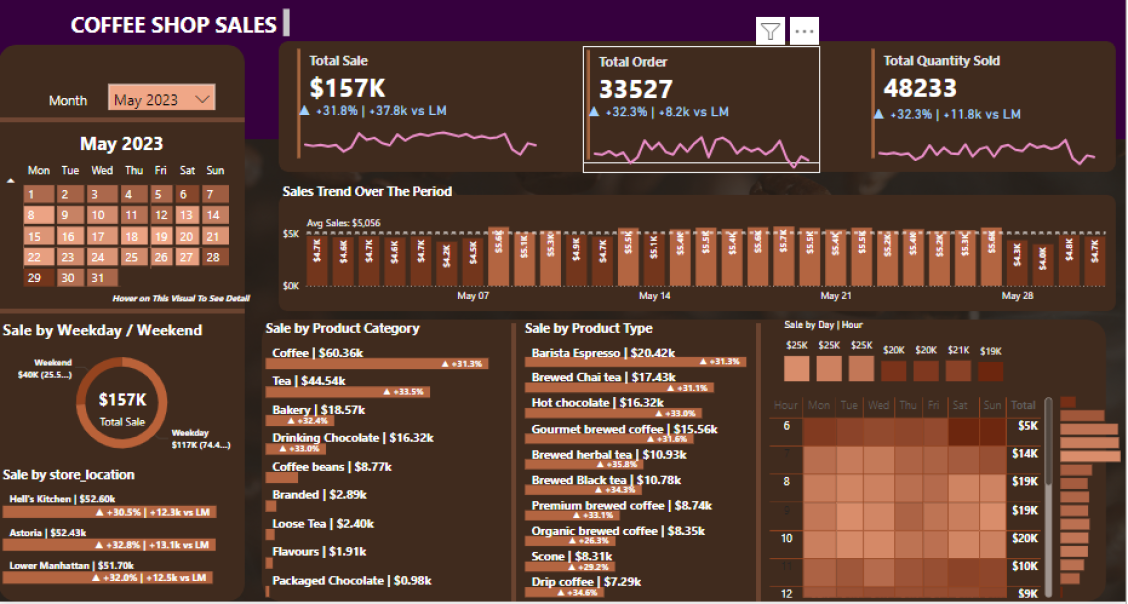
This dashboard centralizes key performance indicators (KPIs) including Total Sales ($157K), Total Orders, and Quantity Sold. By providing a month-over-month growth and trend line, management can immediately identify if they are hitting their targets compared to previous months.
The dashboard breaks down sales by Category (Coffee, Tea, Bakery) and shows the top 10 most popular items in each group.
By analyzing sales per store (Hell's Kitchen, Astoria, etc.), we can identify regional preferences and optimize local stock.
We integrated a detailed sales trend over specific periods. This granularity allows the business to see peak hours and days. By understanding which product types sell best in which area, the client can deploy targeted marketing campaigns to enhance regional sales.
The transformation of raw spreadsheets into this interactive dashboard gave the client a "Single Source of Truth." With automated ETL pipelines, the manual work of reporting was reduced by 90%, and regional managers can now pivot their strategy based on live location-based data.
+32%
Sales Growth Identified
Clean
Validated Data Set